Actionable insights from your Workforce [arn-post-tag id=11]
Last month, we released the Agent Skill Enhancement Model, providing you tailored made recommendations to level up your workforce performance. Reviewing each agent individually provides the opportunity to build optimized training plans for every agent to improve key metrics. But what about getting an overall picture of your workforce? Which field agent actually requires a training plan? Which observations are the hardest for your agents to resolve?
Which agent needs a training plan?
The new Workforce page’s initial view focuses on 10 lower performing agents for each KPI. Depending on your strategy, you can focus on the WPI (Workforce Performance Index), FTF (First Time Fix), CPS (Cost per Success), MTTR (Mean Time to Resolution) or MTBE (Mean Time between Events) to understand which agents require additional training and focus. Clicking on each pink dot will display a comprehensive description of the agent performance, emphasizing the observations that lead to better results.
Moreover, thanks to the “All Agents” view, you’re able to identify outliers among the workforce.
The new Workforce page’s initial view focuses on emphasizes 10 lower performing agents for each KPI. Depending on your strategy, you can focus on the WPI, FTF, CPS, MTTR or MTBE to understand which agents require additional training and focus. Clicking on each pink dot will display a comprehensive description of the agent performance, emphasizing the observations that lead to better results.
Moreover, thanks to the “All Agents” view, you’re able to identify outliers among the workforce.
Which observations is my workforce struggling with?
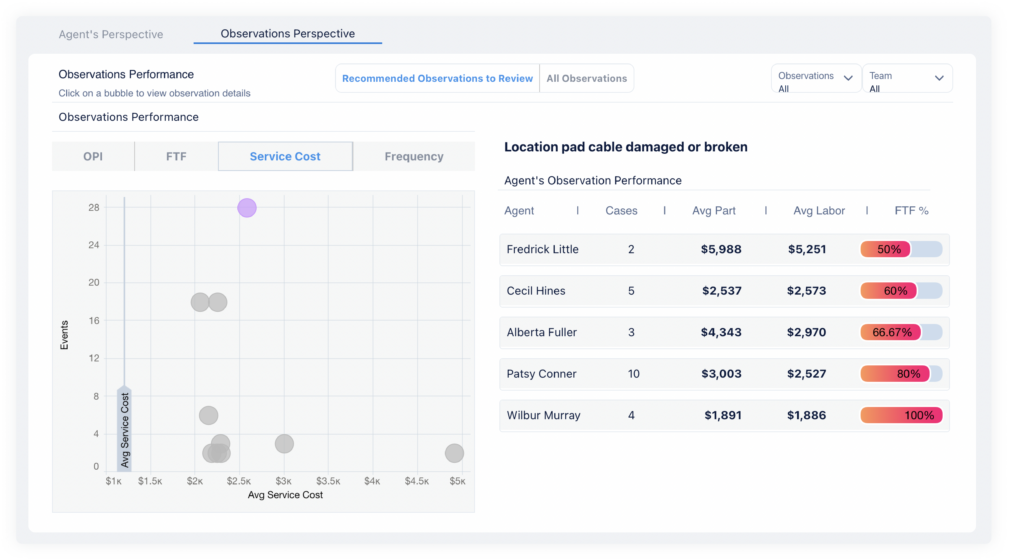
Based on the same concept, the "Observations Perspective" tab will raise insights through the observations' lens. By default, we’ll show the recommended observations you should review, ranked by the selected KPI:
- OPI - Ranks observation by solution difficulty, as experienced by your workforce. The OPI is calculated based on the observations’ frequency, solution distribution and FTF rate.
- FTF - Low FTF induces multiple events to eventually close the case
- Service Cost - The more expensive, including all kind of costs (labor, costs)
- Frequency - The observations that occur most often
Clicking on each pink dot will display detailed information about how your workforce handled the cases. Per agent and for any specific observation, you’ll know:
- The FTF rate
- The number of cases
- The average part cost
- The average labor cost
Based on this, you will be able to dedicate a group session for any observation requiring specific training.
Do you want to get an overall view of the observations managed by your workforce? Click on "All Observations" and start investigating.
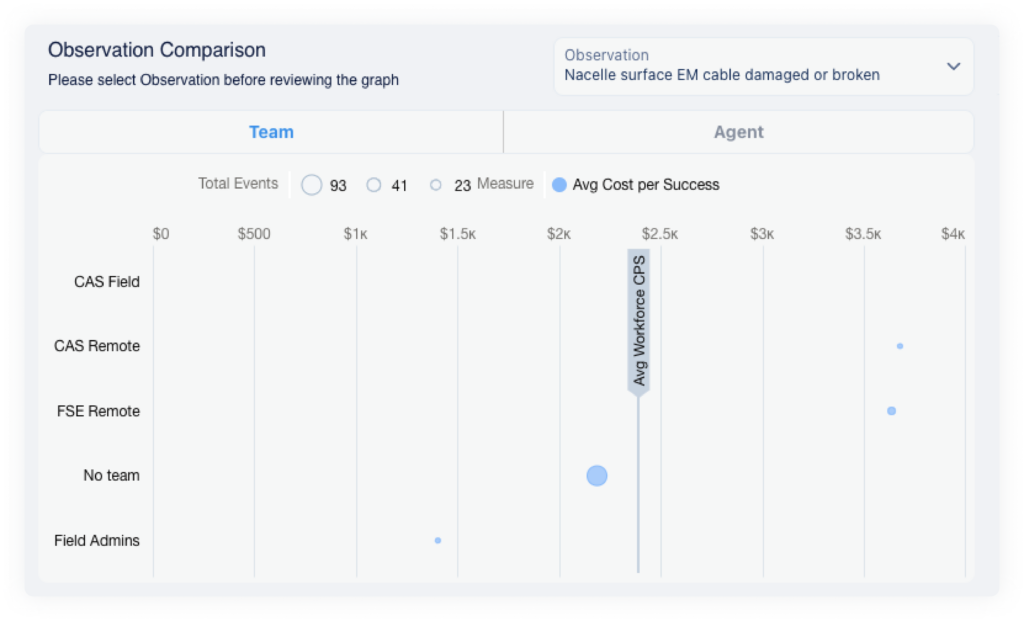
Observation comparison by Team
In addition to this analysis based on the agent's individual level, you can also get a “team level” perspective in the Workforce Comparison page. After selecting an observation, you will see how each team handled the same observation. Thus, it will help you better assess your teams' performance on a wider spectrum.
Parts shotgunning and quality assessment [arn-post-tag id=12]
Analyzing your workforce performance gives you an opportunity to level up your teams’ skills while optimizing costs. Further reductions in cost can be made by identifying parts shotgunning behavior, and by choosing to use more reliable parts.
Parts shotgunning

What do we mean by “Parts shotgunning”? Shotgunning refers to solving an issue with an asset using an unnecessary part replacement, where a cheaper or more effective solution exists. Identifying parts shotgunning will lead to:
- Finding out where your workforce needs training
- Avoiding increased costs by preventing unnecessary parts replacement
The new Shotgunning Parts Analysis Chart on the Parts page will help you in this approach:
On the left, the Parts chart rank parts by their highest estimated shotgun cost. Clicking on the blue dot will filter the agents list on the right.
Parts reliability assessment
Along with your workforce training optimization, parts reliability assessment will provide you with clues on how to save costs and identify quality issues.
The new Parts page raises parts to review, based on different criterias:
- Top Trending Parts
- Highest Cost
- Reliability Trend
- Lowest FTF
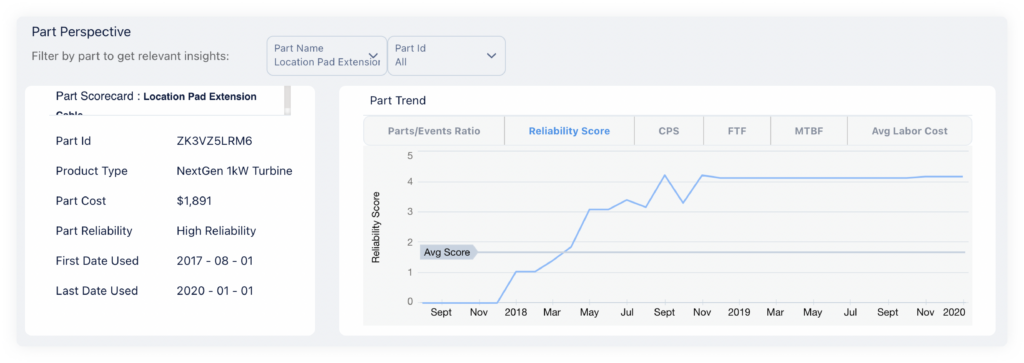
Let’s take a deeper look at the Reliability Trend. The Reliability Trend is based on Aquant’s new data model, and scores the reliability of parts used during service and maintenance. The reliability trend will emphasize the score’s behavior over time. As an example, sharp drops in performance may indicate manufacturing faults or other root causes.
Filtering by a specific part will let you see this evolution over time:
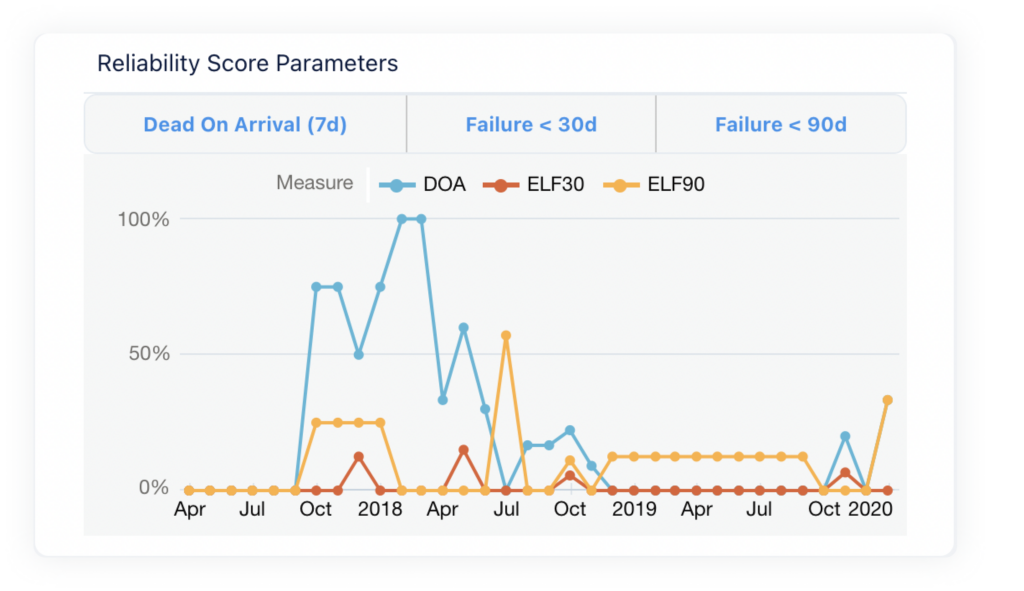
How do we quantify parts performance?
Defining the part reliability score relies on 3 main points:
- Early life failures
- Mean time to failure
- Failure distribution
Zooming in on the time failures occur raises insights about parts quality and their performance.
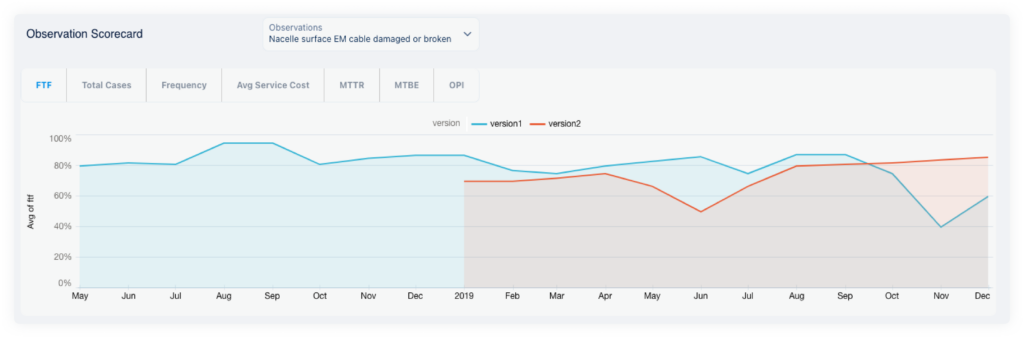
Version Behavioral Analysis [arn-post-tag id=12]
Have you tried to track the impact that product changes have on your service performance?
From now on, you have the opportunity to compare the observations’ performance over time for each assets' versions using different KPIs. Reach out to your CSM to know how to enable this new feature!
Any feedback on our new releases?
Please feel free to reach out to us and we’ll set up a Q&A session along with your Customer Success Manager.