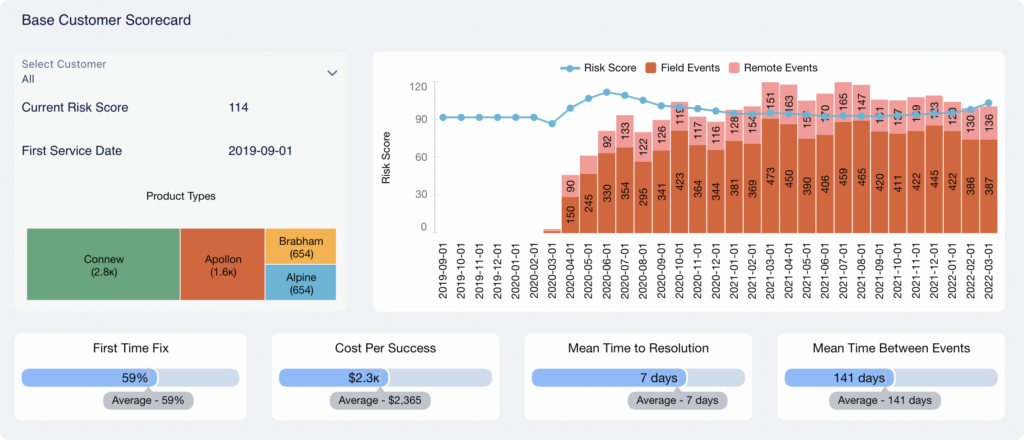
Success Definition per Product Line [arn-post-tag id=12]
When it comes to KPI measurements, defining events success or failure is critical.
Quick reminder: how do we define success or failure?
Until now, we have considered a service visit to be successful when the next visit happens after more than x days defined by either the default metric (30 days) or by a single custom day interval.
However, product characteristics as well as business models can differ from one product line to another, leading to a need to measure success differently, even within the same company. As a result, considering one single default metric for all product lines, rather than per product, leaves behind particularities and prevents you from comparing KPIs on a company level.
Therefore, in order to more accurately determine success, you can now set up a custom success metric for each individual product line.
PME Model Optimizations [arn-post-tag id=11]
Relative effectiveness through historical trends
The PME model provides insights into the performance of preventative maintenance and how it changes over time. Each PM event, and asset, is assigned a score, allowing the maintenance performance to be classified as either effective or ineffective.
Concretely, all maintenance visits are equally assessed through the lens of service costs and mean time between events. We used to define effectiveness by comparing the PME score to the same absolute median threshold for all assets of all product lines.
But what about the maintenance events when assets have an exceptionally high usage, then requiring more visits than the average? Or when assets got defects?
Many reasons can explain high servicing costs or multiple events following the maintenance visit, even though your field technicians actually have performed an effective service.
In fact, what matters most is the impact of maintenance over an asset, considering it in its whole ecosystem, following its own properties or behaviors.
For this purpose, we’ve optimized our PME model by updating this criteria defining the effectiveness of an event. We are now automatically calculating a relative threshold, for each asset, that integrates its historical trend to better classify your events either as effective or ineffective.
It will turn out much easier to distinguish between issues coming from product quality, customers behaviors and usage, or service quality.
Time to Failure adjustments
Additionally, because multiple service events can happen the same day as a preventative maintenance event, these events are now excluded from the Time to Failure after Preventative Maintenance calculation.
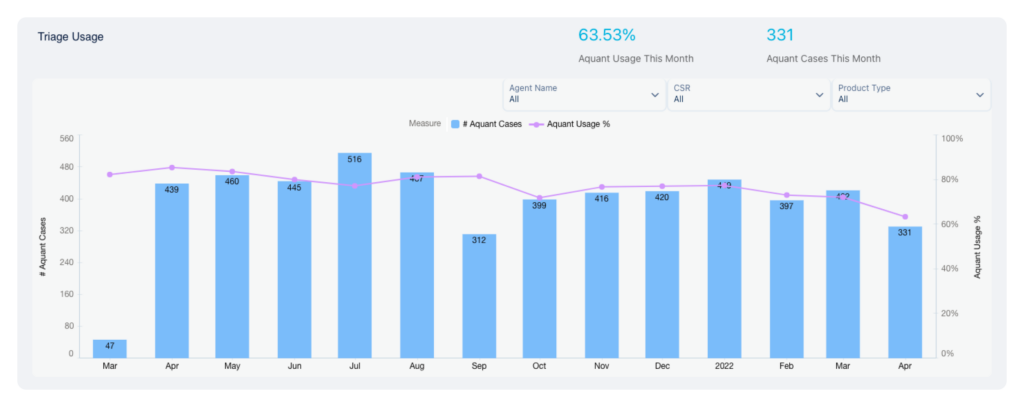
Triage Usage Measurement [arn-post-tag id=11]
Triage usage analysis provides you the insights to better understand the impact of our product on your company. How many cases are solved thanks to Triage? How does Triage actually help your workforce to reduce cost while reaching a higher customer satisfaction?
So far, Service Insights / Triage page was retrieving key data to analyze your workforce in its entirety, regardless of whether some teams are meant to use Triage or not, to mention only one case.
From now on, we have the option to filter out specific teams or events. Thus, your Triage usage might get a boost, but for the best since you will get a more precise picture of your workforce Triage usage.
Any feedback on our new releases?
Please feel free to reach out to us and we’ll set up a Q&A session along with your Customer Success Manager.