Preventative Maintenance [arn-post-tag id=12]
The whole concept of Preventative Maintenance could be summed up by one saying: Better safe than sorry! In other words, anticipating and preventing machine breaks and issues by scheduling maintenance visits will help you save money by reducing service costs.
Based on an analysis of service cost trends, our new data model allows you to understand your assets’ life cycle through insights into its maintenance effectiveness and requirements.
Your entire customer experience will be impacted by your new ability to:
- Identify assets that require immediate maintenance
- Identify customers experiencing subpar asset maintenance
- Leverage or upskill your team on maintenance orders
Meet the PME Score (Preventative Maintenance Effectiveness)
Aquant’s Preventative Maintenance Effectiveness (PME) model quantifies the performance of preventative maintenance visits through the analysis of service trends throughout the asset’s life cycle. Through evaluation of maintenance events, we gain a better view of how assets perform over time, increase workforce capability, and better understanding what customers are experiencing.
The PME model currently considers 3 different aspects of an asset’s life cycle:
- Maintenance timing and its effect on service costs
- Time to failure after a maintenance event
- Service cost variation after a maintenance event
Be Ahead of Your Customers’ Concerns
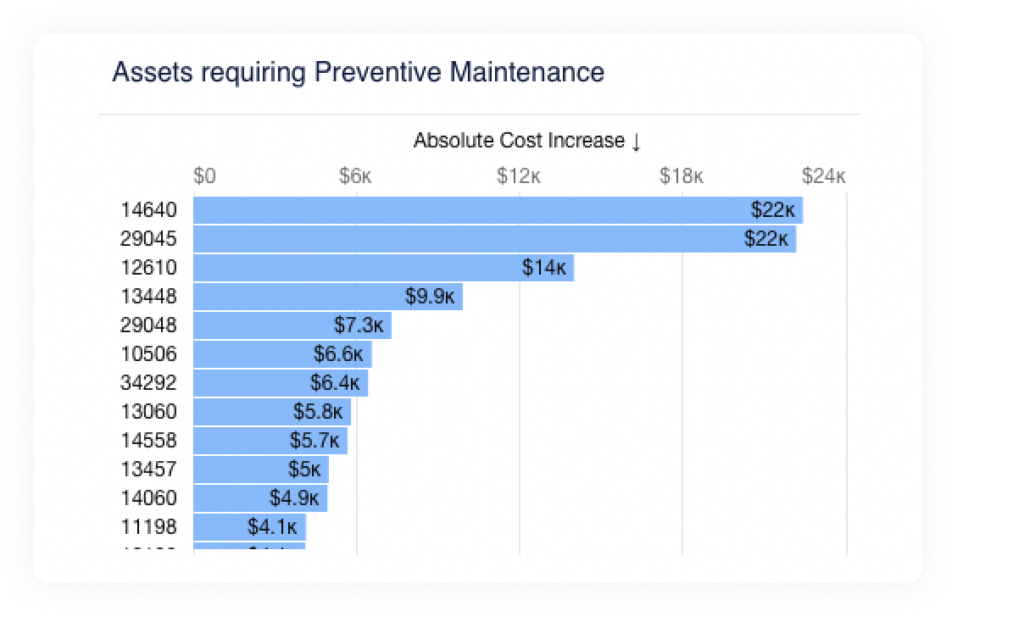
Under-maintained assets have an increased tendency to fail, creating unplanned downtime and increased service costs. By looking out for assets with recent increases in their servicing costs we can find assets which require preventative maintenance in the near future. Visit the Assets page to find out which assets have been identified.
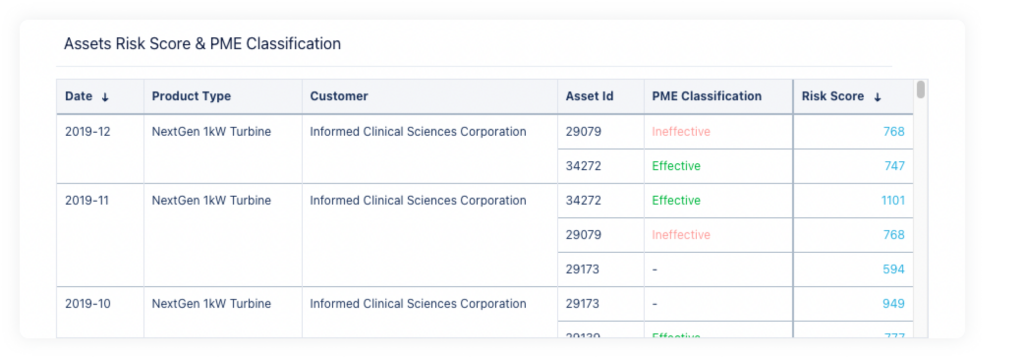
Alongside the Customer Risk Score, a new column “PME Classification” was added to give an overview of the maintenance events' effectiveness per asset, filtered by product type and customers.
With this information, you will be able to deep dive into the assets’ lifecycle through the Asset Cost & Maintenance Effectiveness chart.
Understand Your Assets’ Story
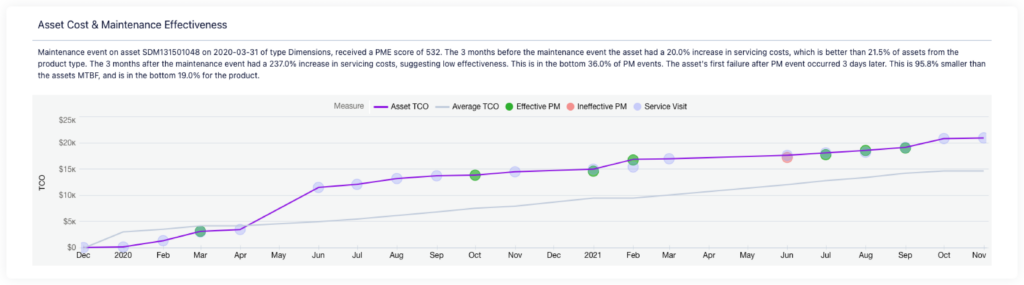
You are already familiar with the Asset TCO (Total Cost of Ownership) and Average TCO (based on the average TCO of the product type) trends. These trends have now been enriched with Service Visits and Preventative Maintenance events. Besides the trends themselves, you have the opportunity to understand which events had the greatest impact on your asset lifecycle, and which ones are missing.
To better introduce you to our new model, an explanatory text above the chart details how to interpret the main maintenance event.
Get Actionable Insights About Your Team
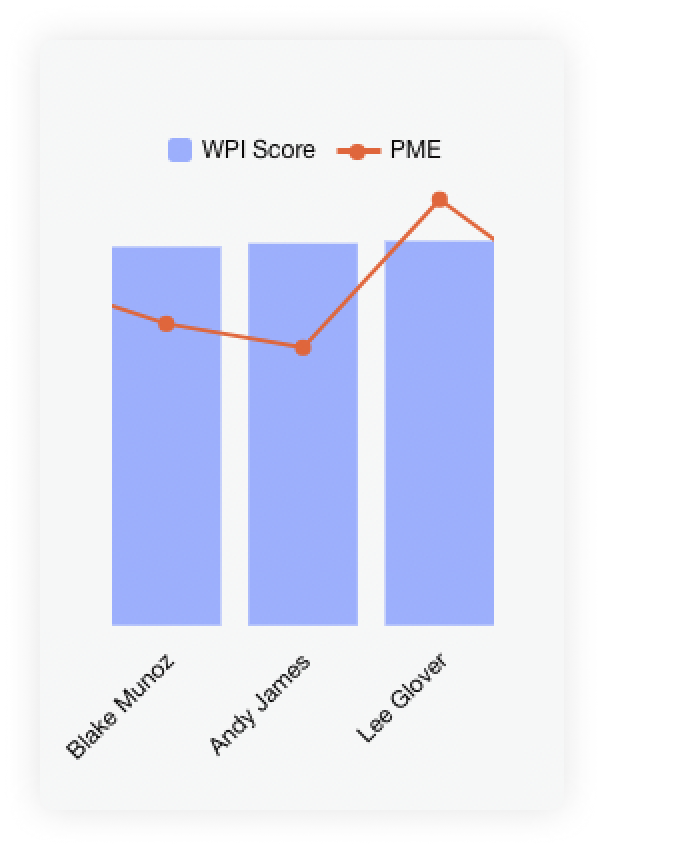
Because each event is handled by your workforce, assessing Preventative Maintenance Effectiveness reveals how you can optimize and leverage your field agents. Identifying workers that have high or low PME will empower you to pair your team for better performance or even to consider training on specific assets.
Improving Data Consistency, Integrity and Veracity [arn-post-tag id=11]
Optimized Model to Classify Service Visits as Success or Failure
Aquant models are built from a Customer Experience point of view, and concluding a service-visit as success or failure forms the foundation of our data accuracy when calculating Service KPIs. Now, the conclusion model has been optimized to reach a higher precision level in order to provide a reliable base towards the end of the data period, where there may be no clear indication regarding the status of a visit.
Considering Multiple Roles for One Single Worker
Measuring workforce performance and acting based on the provided insights becomes challenging when an individual has multiple roles within the service organization. To simplify the process we now determine heuristically which role is more dominant and as a result, all KPIs for this worker are calculated considering the relevant role, allowing for a more concrete attribution of insights.
Data Cleaning Improvements
Cleaning up the data is traditionally the most time consuming part of the data preparation process, but it’s crucial for removing faulty data and filling in gaps. In the new version of our processing system we improved our automatic process of filling in missing values. Fewer gaps lead to more data points and more accuracy in your dashboard analysis.
Detailed Asset Risk Score per Customer [arn-post-tag id=12]
Last but not least, raising clear insights embodies our product vision.
Does going over Customer risk score makes you wonder whether one single asset is responsible for a high score or not?
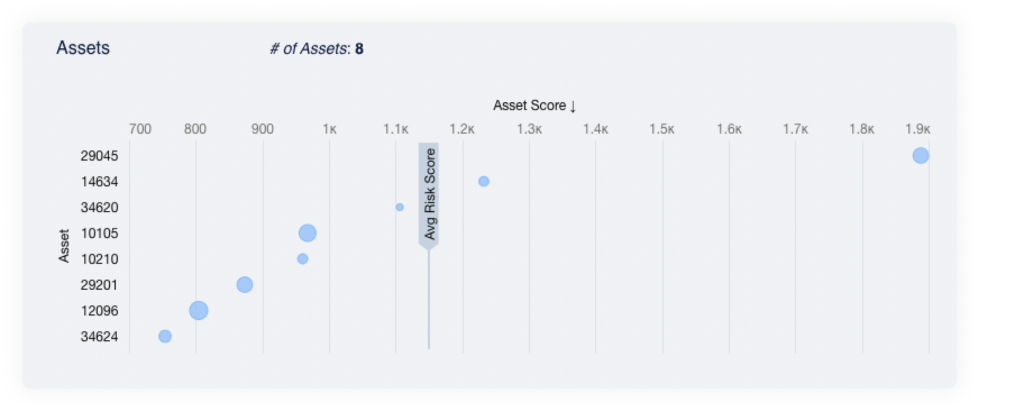
On the Customers page you’ll find a brand new chart displaying a score per assets owned by customers. From now on, you'll be able to easily find at-risk assets, helping you identify which ones need a thorough investigation.
Any feedback on our new releases?
Please feel free to reach out to us and we’ll set up a Q&A session along with your Customer Success Manager.