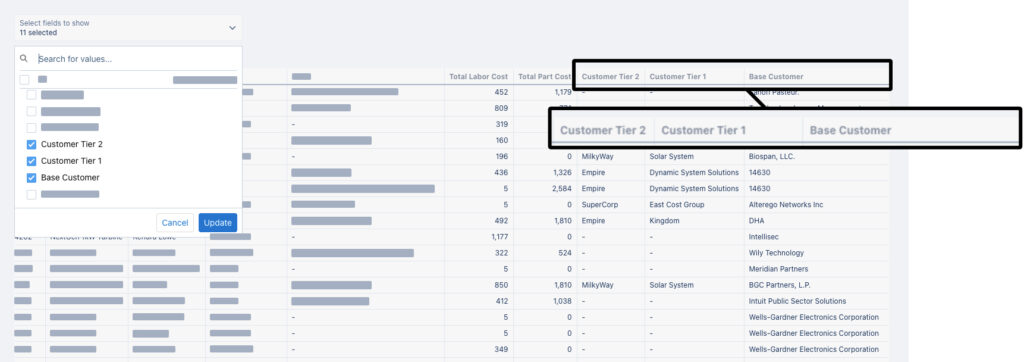
Customer Hierarchy
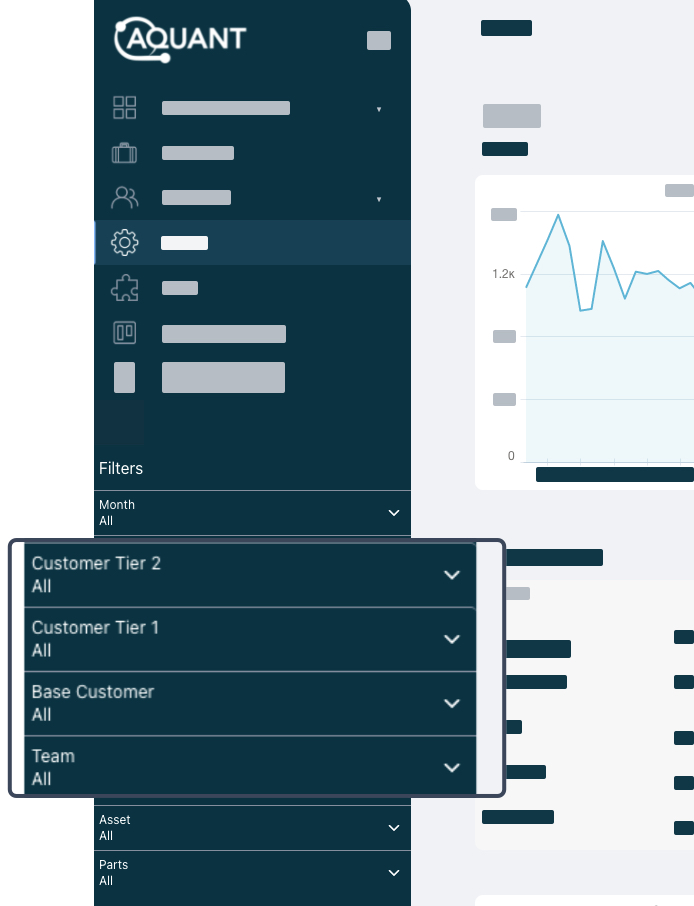
With the introduction of Customer Hierarchy, users can now view up to three levels of their customer's hierarchy in various places in the dashboard: through global filters and in the reference tables. It is worth noting that the additional customer hierarchy information will only appear if there are customer tiers established in the data tables. These global filters are located at the bottom right section of every page.
"Next Potential Symptom" Widget
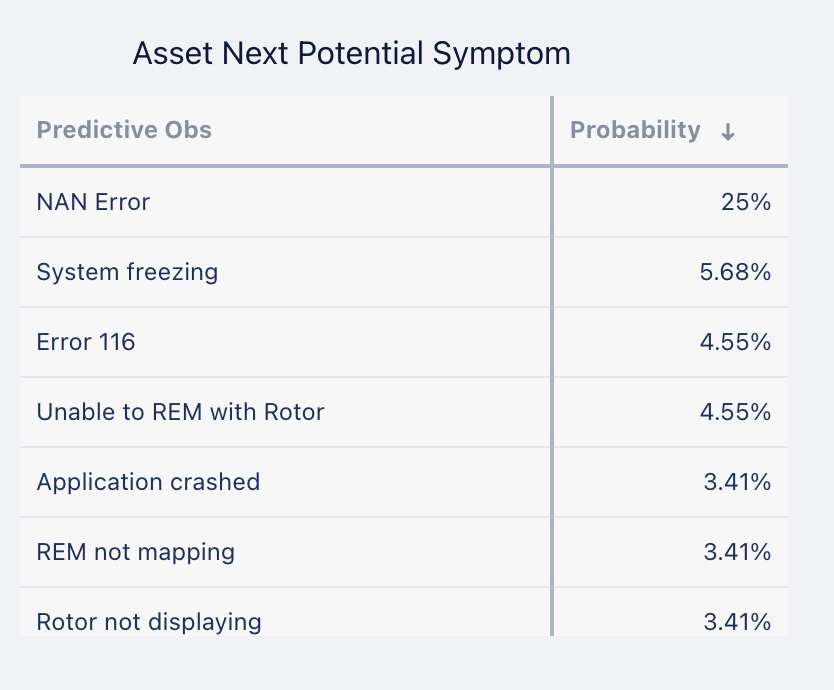
This widget, located in the Assets tab, shows the next possible issue and its probability of happening within the next 90 days for each asset. Service Insights leverages the power of historical data to surface potential problems so that the user can keep an eye on specific assets and avoid customer escalation.
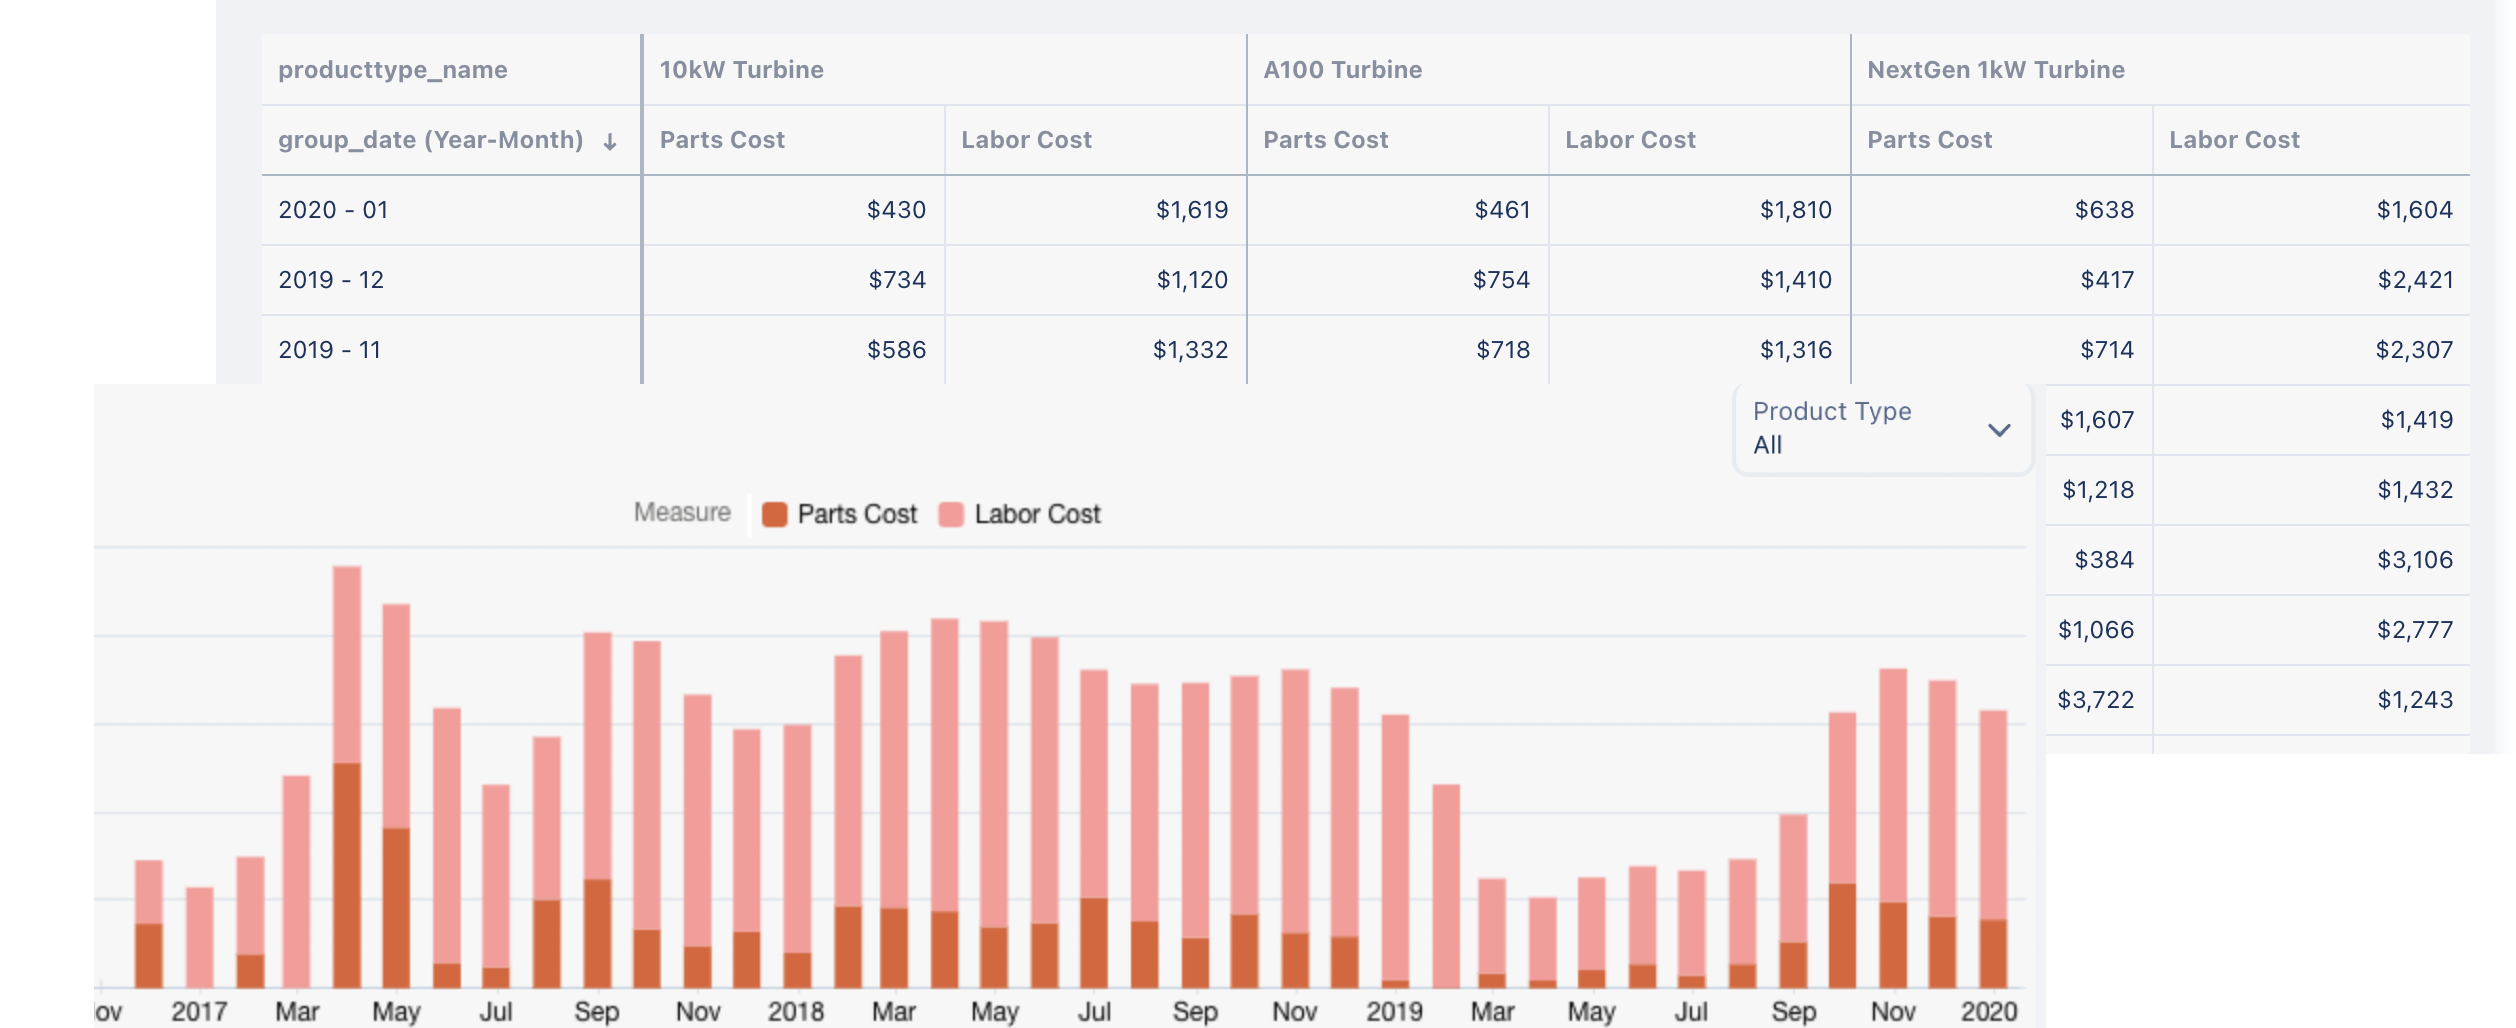
New CPS Widget Capabilities
With the newly expanded Cost Per Success widget in the KPI expanded tab, users can see their Cost Per Success broken down by parts cost and labor cost in an easy-to-read stacked bar graph and accompanying table.
Additional Optional Reference Table Selections
Users may now add labor duration and parent event id fields to reference tables throughout Service Insights.