Refining Asset Risk Score
Improved risk accuracy
The most important motto in the Service industry relies on service costs reduction while keeping high customer satisfaction. To ensure this equation, we have introduced our Asset Risk Score model. Based on 3 main pillars - the Mean Time Between Visits, the Total Cost of ownership and the Cost per Success, the score aims to identify problematic assets and prevent decline in the customer’s experience.
In addition to these key performance indicators, we have utilized customer feedback, as well as our own research in the Service industry to enrich our data model and dive deeper in the assets lifecycle. This gives us a better understanding of the asset’s current status.
Along with our 3 pillars, new components have been added to the Asset Risk Score. Let’s review them together.
Asset age
As an asset ages, performance tends to decrease, and servicing costs increase. This risk model now considers the asset age while assessing its performance.
Lack of asset activity
Would it be reasonable to think about an asset lifecycle without any service or maintenance events? Unless the assets have been removed from any use, or not registered in the company system, they necessarily go through these kinds of events. The asset risk score now considers the time since the asset has last been serviced/maintained, and correspondingly identifies assets which have not been visited for longer than expected.
Maintenance events
The Preventative Maintenance Effectiveness (PME) model assesses whether a maintenance event has been effective or not. Ineffectiveness, as well as maintenance cost, contributes to asset risk.
Do you want more information about the PME model? Read our releases notes:
A straight-forward approach to risk awareness
Identifying quickly high risk assets is key to anticipate escalations and define next steps to improve customer satisfaction.
For this purpose, we have simplified the Asset Risk Score table to highlight the assets that require your attention. The risk is breakdown into 3 categories:
- High for the top 20% of assets
- Medium for assets from the 80th to 20th percentile
- Low for the bottom 20% of assets
Clicking on a line will filter the page by the selected asset, enabling you to easily deep dive to find out the story behind this alert.
Turn Parts usage history into actionable insights
Improve risk accuracy
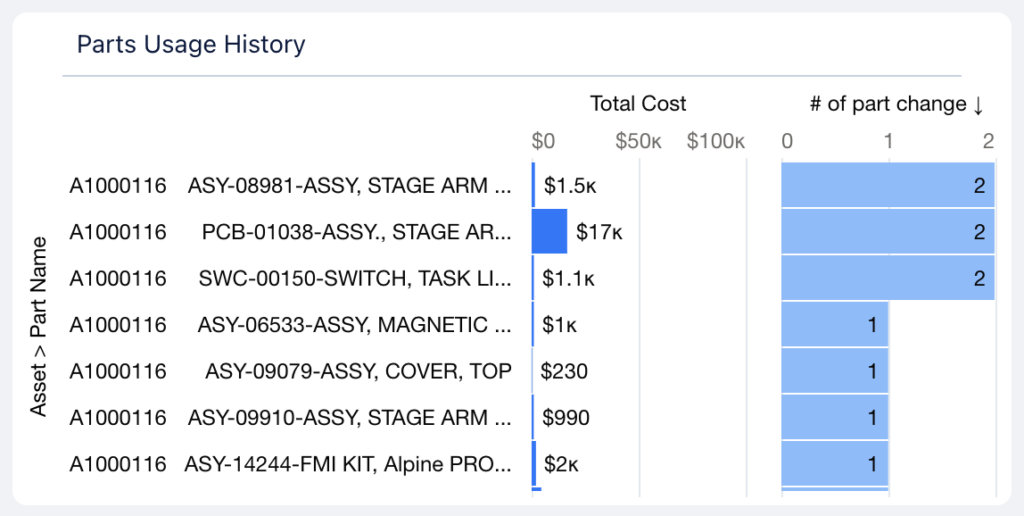
Parts replacement represents one major component in the assets lifecycle, as it enlightens its health analysis and explains the Total Cost of Ownership growth.
Because of this, we have updated the Parts usage history: the number of multiple part changes is now displayed in place of the latest part change. Alongside the cost, it provides you with actionable insights about the assets by emphasizing the most repaired assets.
Renaming workforce classification
Introducing Performers
Heroes, Contenders and Challengers used to represent the way we classified the workforce to better understand its performance. Referring to this classification helps identify the best agents to solve specific problems, or even the ones to send for ride along or training.
The essence of the classification has not been changed in this new version, but we have introduced a different terminology.
Based on the career stages where we are progressing from Junior to Senior, our Heroes, Contenders and Challengers terminology no longer matches the insights we are providing, or even the complexity of the field.
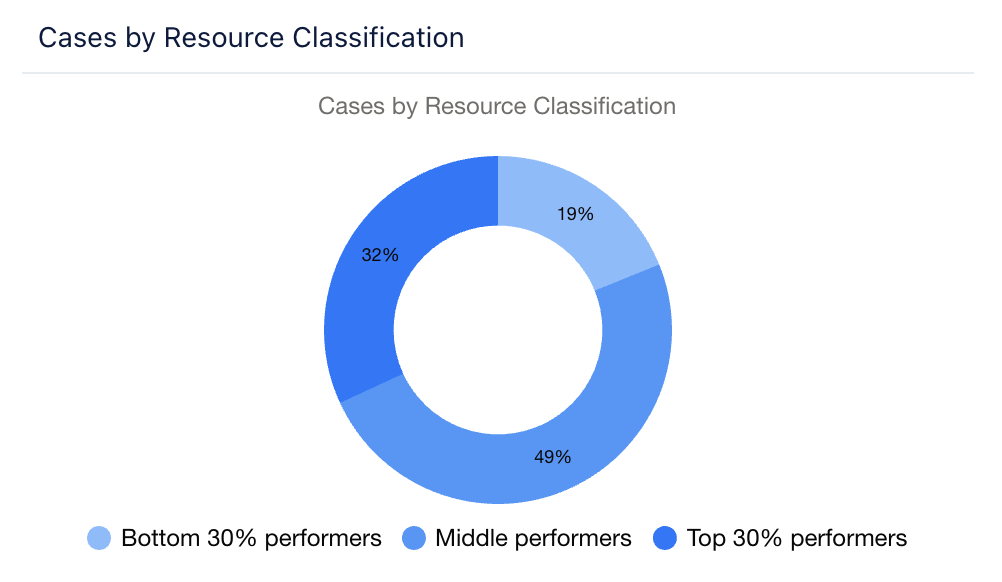
One single agent can fit different categories depending on the product or the observation types. Referring now to a different reality, we have introduced these changes:
- Heroes become Top 30% performers
- Contenders become Middle performers
- Challengers become Bottom 30% performers
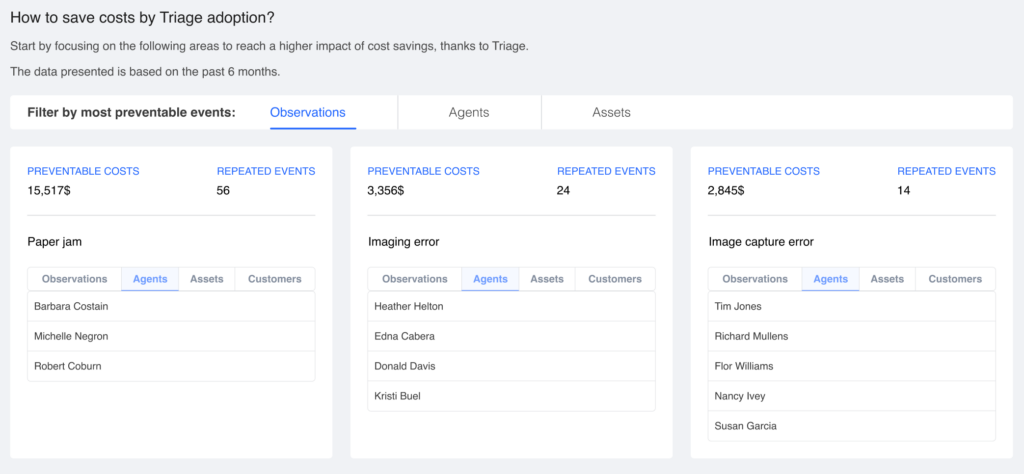
Understand impact of Triage usage
“What if” scenarios
Part of change management relies on adoption statistics. Does the transition smooth enough to onboard all your agents? How does this new methodology impact your business goals and results?
For that purpose, the Triage page already shows Triage usage, as well as a comparison of your overall KPIs with and without Aquant.
In this new version, we have enriched the page with a new Preventable-events analysis section. Our “what if” scenario goes further by analyzing service visits to understand how many could have been prevented if Triage solutions would have been implemented, as well as how much could have been saved.
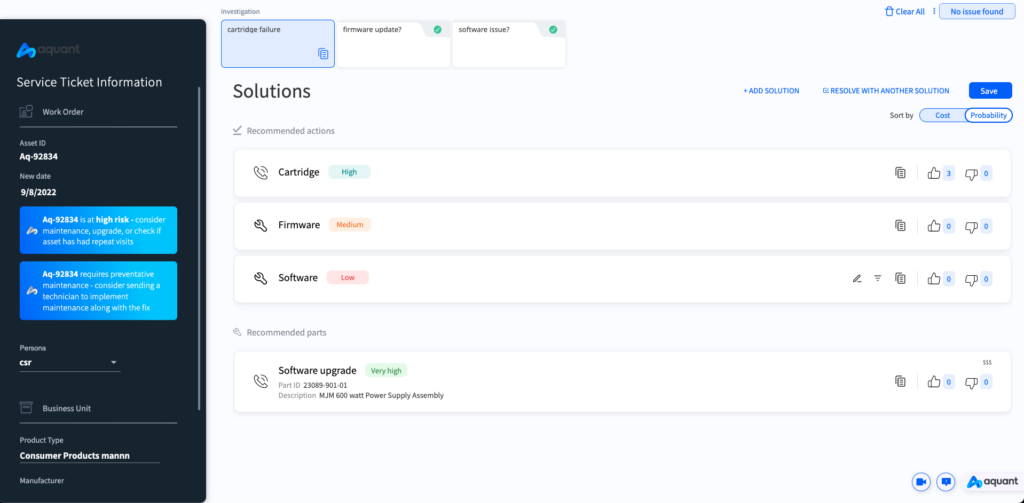
Service Insights in Triage
Bringing insights where you need them
Service Insights Dashboard enables you to perform deep analysis as well as reach informed decisions based on data. How to improve your workforce performance? Which customers need attention?
But what about your own agents?
We know that knowledge helps us perform better. This is why we are now displaying Service Insights inputs on Triage interface:
- The asset risk classification to give context to the agent in charge
- An alert to implement maintenance on assets requiring it, based on the PME model
Do you want to know more about the changes on your Triage app? Please reach out to your Customer Manager to get a demo!
Any feedback on our new releases?
Please feel free to reach out to us and we’ll set up a Q&A session along with your Customer Success Manager.